AXIOM
I tried to build a daily stock-prediction signal, caught the first version leaking, and rebuilt it carefully. This page shows what's left after a clean test: a small signal that loses to just holding the market.
Can daily price and volume data beat buy-and-hold?
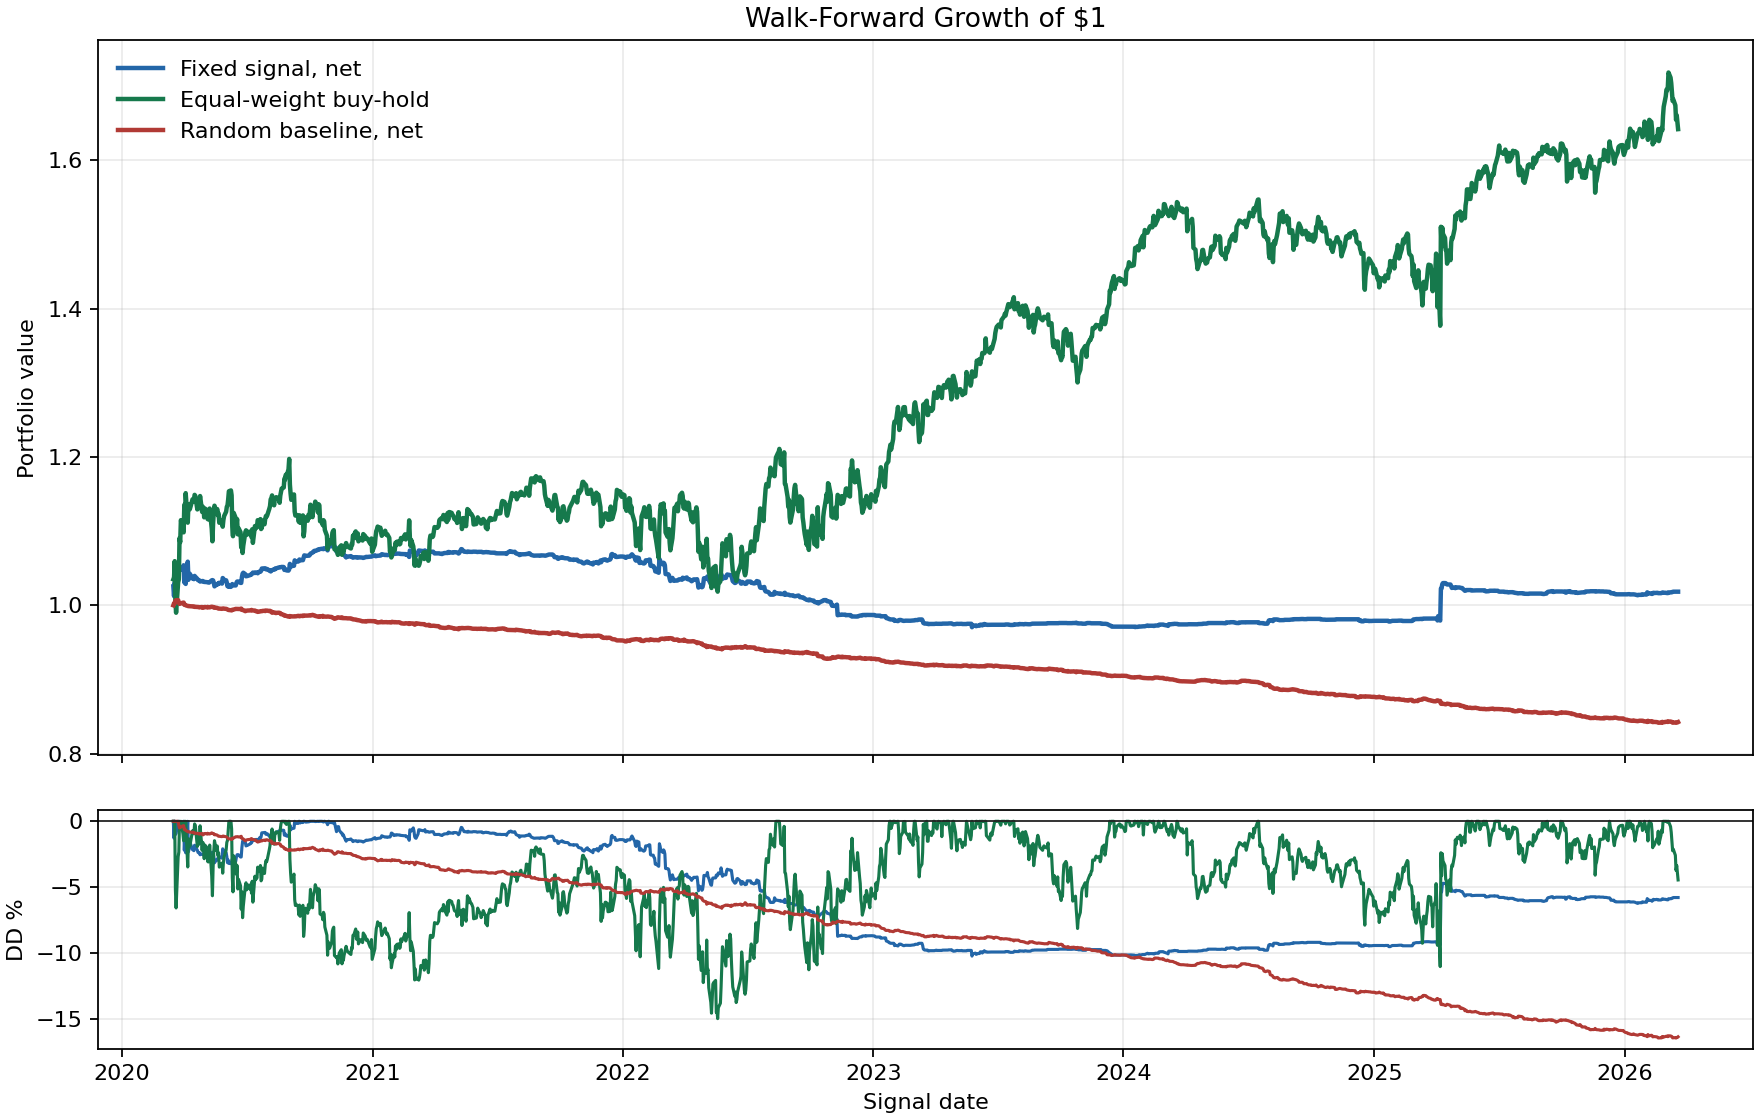
Short version: the model finds a tiny positive signal, but it loses to just holding the same names and doesn't survive a Sharpe adjustment for how many things I tried.
| Method | Total Return | Ann. Sharpe | Max Drawdown | Interpretation |
|---|---|---|---|---|
| Fixed logistic signal, net | +1.84% | 0.097 | -10.21% | Real but tiny; barely positive after costs. |
| Equal-weight buy-hold | +64.20% | 0.646 | -14.95% | Just holding the names wins easily. |
| Zero-skill random, net | -15.74% | -3.499 | -16.42% | Trades at the same rate; shows the cost drag. |
What keeps the test clean
The harness is built to fail the strategy if it can. Every transform is fit inside the training fold, trades lag the signal by a day, and the baselines use the same data the signal does.
StandardScaler is inside the sklearn pipeline and fit only on training slices.| Diagnostic | Value |
|---|---|
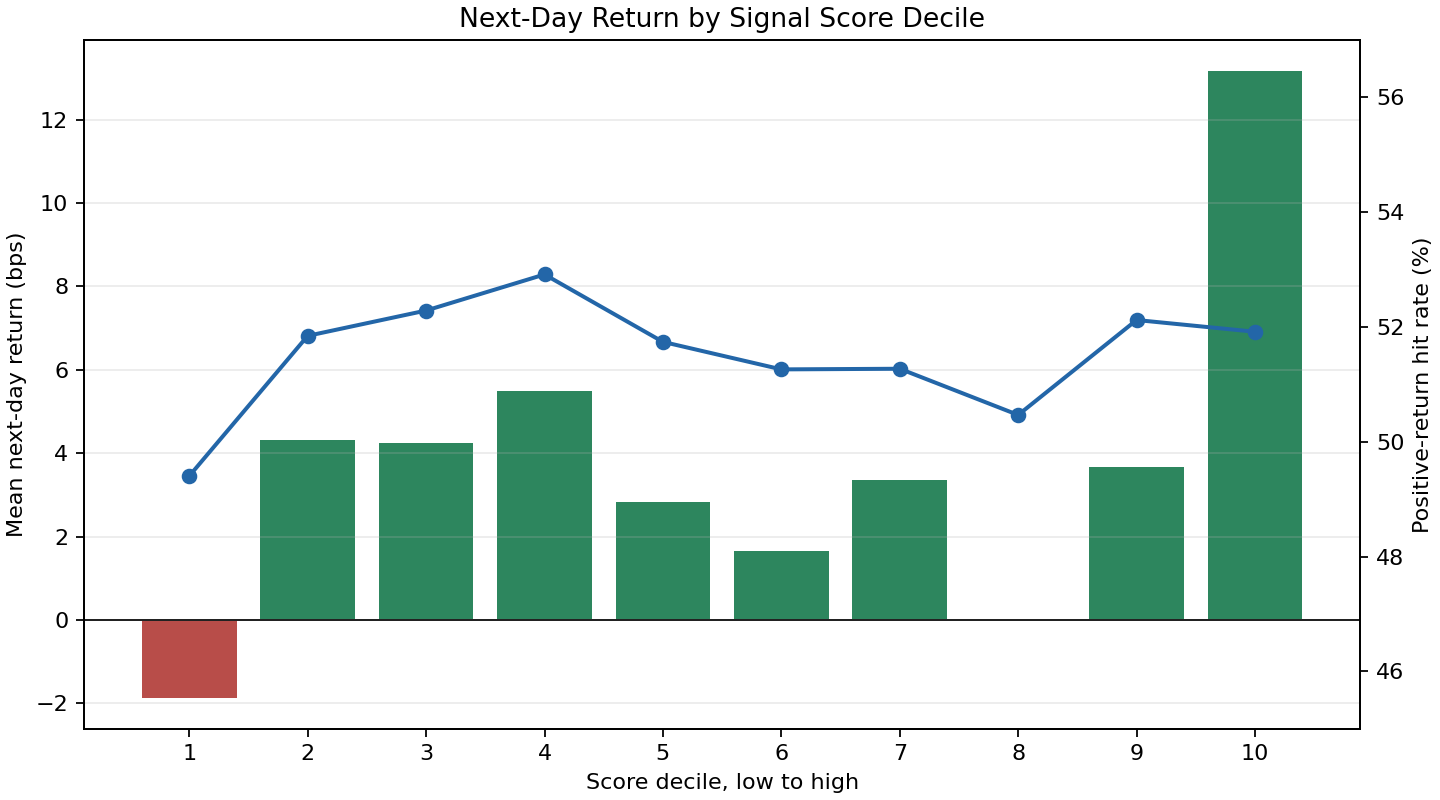
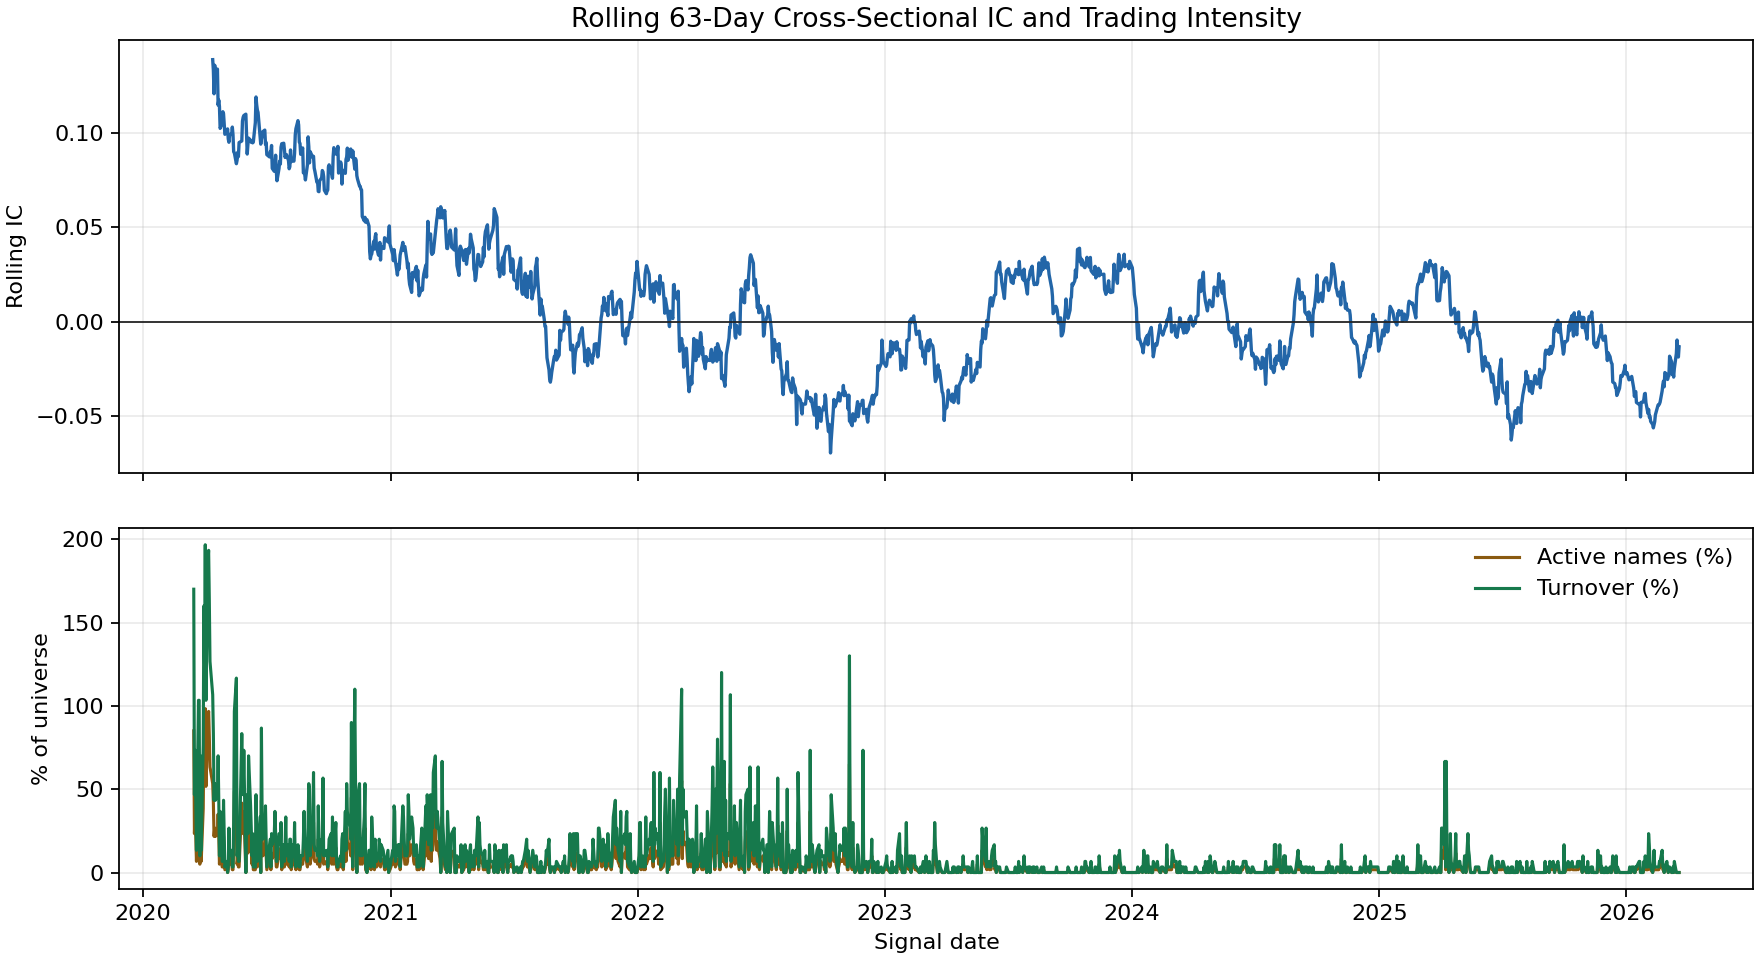
| IC t-stat | 2.19 |
| Active hit rate | 53.47% |
| Active fraction | 5.36% |
| Configuration lower bound | 41 |
| DSR probability | 1.79e-235 |
What the plots show
These are the three plots I actually care about: does it beat the baselines, does a higher score mean a higher return, and does the signal hold up over time.
Why the old numbers can't be trusted
I kept the earlier experiments because they show how good-looking metrics come out of a narrow ticker list, same-bar trades, and trying a lot of configs.